
See who is moving forward and who is stuck
Revenue, progress, retention and struggling students — for the school, each course and every student. And a live picture every 5 seconds while on air.
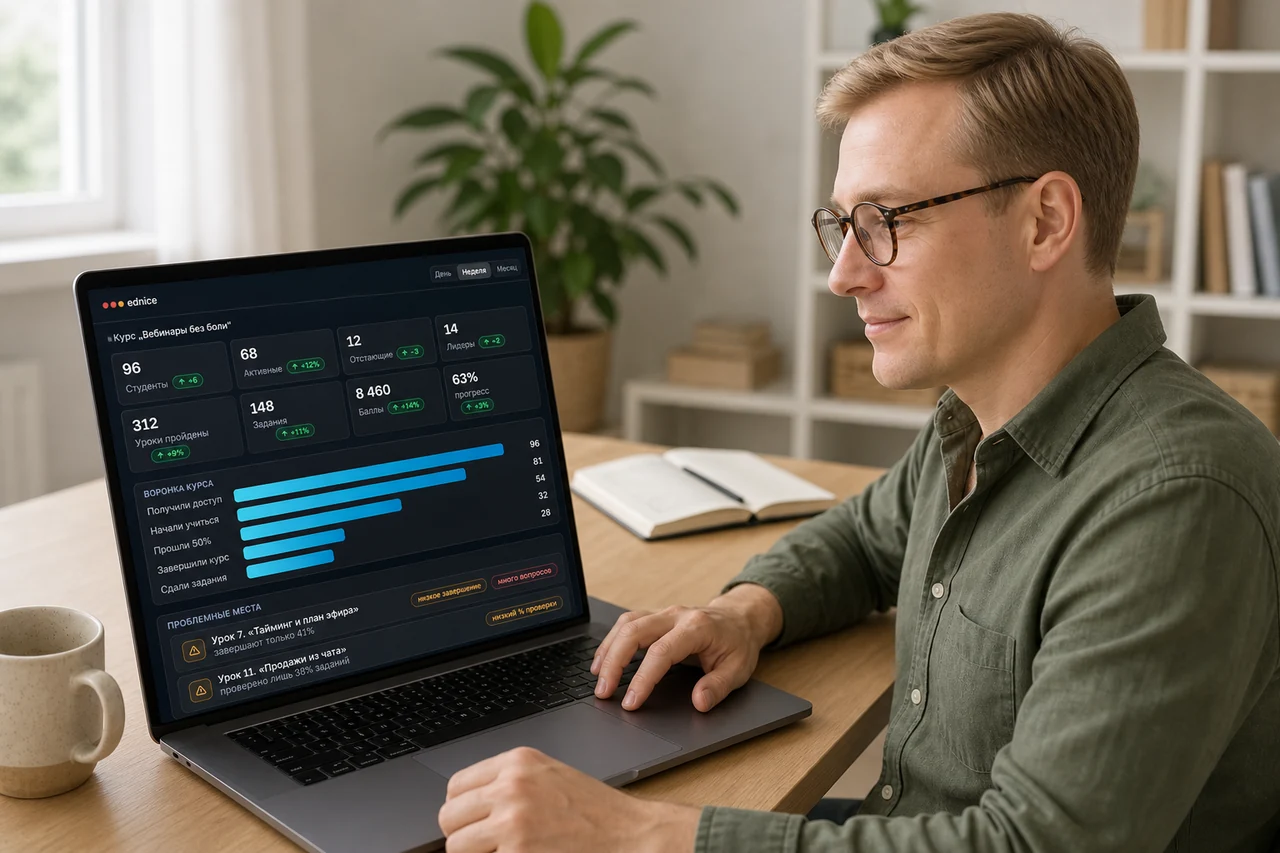
Course analytics
Eight metrics with trends versus the previous period, a funnel from access to assignments, and the spots where students stumble.
Every student at a glance
Lesson progress, assignments, points and an activity calendar — switch between students and watch the picture change.
The whole school on one screen
Revenue and payouts, orders and students, top courses and those needing attention. The platform fee is visible right away — no hidden lines.
Plus live stream analytics
During a webinar you see online count, engagement and retention — the picture refreshes every 5 seconds.
From event to decision
Analytics collects itself — you just look and help in time.
A student learns
Watches lessons, submits assignments, receives rewards.
Events are collected
Every view, submission and payment is recorded by the platform.
Metrics are computed
Progress, retention, revenue and trends — without your spreadsheets.
You see who fell behind
Struggling students and problem lessons are highlighted right away.
You help in time
Message the student or refresh the lesson — before they drop out.
And a few more things
The things that keep the numbers honest.
Honest empty states
If there is no data yet, the block says exactly that — no zeros and dead charts.
Filters by course and period
Day, week, month, all time or a custom range — and separately for each course.
Funnel down to assignments
See where students stop: from access to submitted assignments.
Retention and streaks
Return rate, active days and learning streaks — for every student.
Problem lessons with reasons
Low completion, many questions, slow reviews — the reasons are right there.
Revenue and fee made clear
Revenue, payout amount and the platform fee — no hidden lines.
Frequently asked questions
From learning and payment events: lesson views, submitted assignments, points, orders and payments. Nothing to connect or configure — everything is computed automatically.
A lesson counts as completed when 90% of its materials are studied and all assignments are accepted. The average course progress follows the same honest rules.
The block honestly says so: “no data yet” instead of an empty chart. As soon as events appear, the metrics switch on by themselves.
Yes, right away: revenue shows the gross amount, the fee and the payout. Every school has its own terms — and they are always in front of you.
Yes. Basic analytics is included in the $0 plan: course, student and school metrics, plus live stream analytics. Paid options switch on only when your school grows.
Not for a school. A site counter shows visits, but not who stalled on lesson seven or who skipped an assignment. In Ednice, progress, lagging students and revenue come from real learning events — no pixels, tags or a separate analytics account.
The “needs attention” list builds itself: who has not visited for a week, whose progress dropped, which lesson the cohort trips over. You message the student or fix the lesson while they are still here. No Excel, no exports.
Yes. Online count, engagement and retention refresh every 5 seconds — during the stream, not after the recording. By minute 15 you already see where the room dropped off, so you can win attention back instead of reading a report the next day.
Your school in numbers, not in guesses
Open the dashboard — analytics is already computed for your courses and streams.